

Nobody reads the plc diagnostics buffer. Then they call me at 2 am and announce that the program is corrupted. It almost never is. The controller has been explaining itself for six hours, in plain text, with a time stamp, and they walked past it to plug in a laptop and scroll through logic they did not write.
The whole method fits in one order, and that order costs the least time. Front panel first. Buffer second. Module diagnostics third. Program last, and only when the other three have nothing to say.
The order you should check plc diagnostics in
The sequence is not a preference. It is sorted by cost and by how much each answer narrows the search. A front panel glance takes four seconds. The buffer takes two minutes and usually names the fault. Module records take five minutes and name the channel. The program takes an hour and, on a fault that began as a wiring problem, tells you nothing at all.
Table 1: What each diagnostic layer tells you
| Layer | Where it lives | What it answers | Time to read |
|---|---|---|---|
| Front panel | Controller face, status display | Is it running, stopped, faulted, or talking | Seconds |
| Controller log or buffer | Controller memory, online diagnostics | What happened, in what order, when | Two to five minutes |
| Module diagnostics | The module’s own online view | Which module, which channel, what event | Five to ten minutes |
| Raw channel value | Process image or watch table | What the input reads right now | Two minutes |
| The program | Logic, blocks, state machines | Why the logic did what it did | An hour and up |
Working down that table is the discipline. Working up it is what people do at 2 am.
My test: if you cannot state the fault in one sentence after reading the buffer, you are not ready to open the program.
What the front panel says about plc diagnostics
Your controller’s manual has the indicator table. Read it once at your desk, before the machine is down. The pattern matters more than the color. People memorize “red means bad” and then stand in front of a controller where red means a module fault on channel 3 and green flashing means something else entirely.
Rockwell makes this easy on the CompactLogix 5380. A four-character status display on the front shows the current status of communications, module health and I/O fault activity without Studio 5000 Logix Designer open at all. Four characters. That is a fault code on a screen, and it is faster than any laptop will ever boot.
The same controller has a three-position mode switch: RUN, PROG, REM. Check the physical position before anything else, because a switch knocked to PROG during a cleaning shift explains a “random stop” no buffer entry will ever describe.
The display on the front of the CPU
Siemens went further on the S7-1500. The CPU’s own display carries a Diagnostics menu that shows the diagnostic buffer and pending diagnostics messages without a laptop attached. The box on the wall is a diagnostic tool. Most people treat it as decoration.
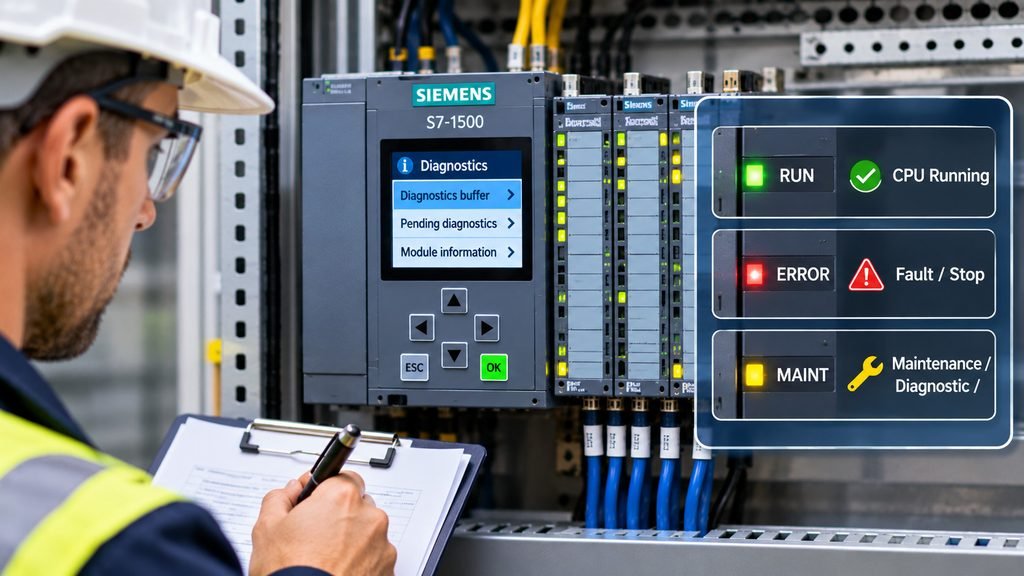
What the panel gives you is a category: communications, module health, I/O fault, mode, power. That is enough to pick your next step and nothing more.
Field note: a communications fault and an I/O fault send you to two different documents. Get the category right at the panel and you skip half the manual.
Reading the plc diagnostics buffer
This is the part almost everyone skips, so read it twice. The plc diagnostics buffer is an ordered event log held in the controller. Each entry carries a time stamp and an event. It is not a snapshot of the current state; it is history, and history is what tells you the order things failed in.
In Siemens STEP 7 and TIA Portal, select the CPU, open Online & Diagnostics, then the Diagnostics buffer folder. Newest entries at one end, oldest at the other, each with a time and an event.
Read the oldest entry first
Read from the oldest entry forward. People scroll to the bottom, read the last alarm, and treat it as the cause. The last alarm is usually a consequence. The first entry after a long quiet period is where the story starts.
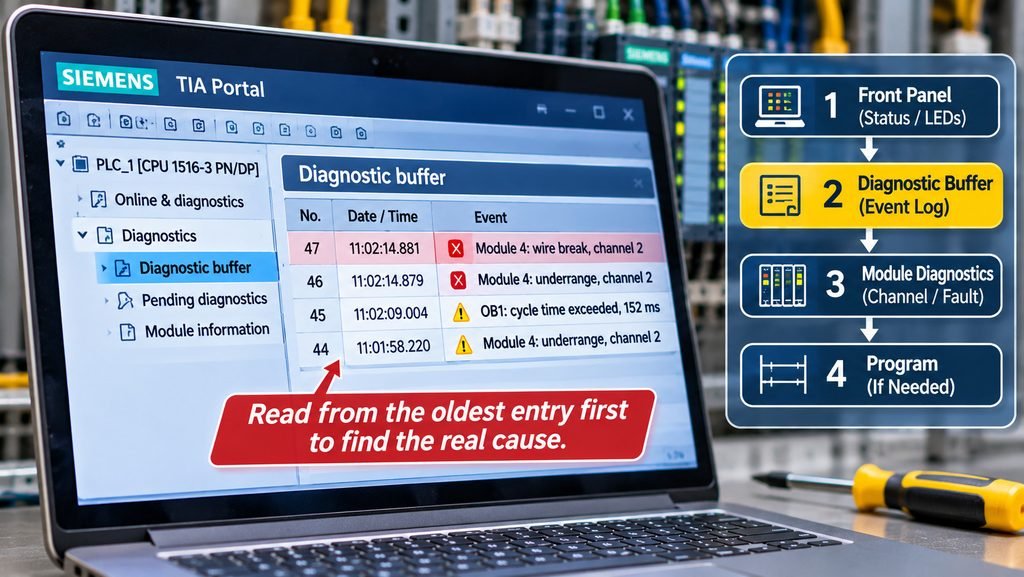
A buffer from a machine that “just stopped” typically reads like this:
  No.   Time                    Event
   47   11:02:14.881   Module 4: wire break, channel 2
   46   11:02:14.879   Module 4: underrange, channel 2
   45   11:02:09.004   OB1: cycle time exceeded, 152 ms
   44   11:01:58.220   Module 4: underrange, channel 2
   43   11:01:41.117   Module 4: underrange, channel 2
   42   09:14:02.660   CPU: operating mode change RUN -> STOP
Four minutes of underrange before the wire break. That is a conductor flexing in a cable carrier, and the answer is in the mechanical drawing, not the logic. The program ran correctly the entire time. It did exactly what a program should do with a signal drifting out of range.
Quick answer: if the first entry is an I/O event, the fault is in the field. If it is a mode change or a cycle time overrun, look at the controller. If it is a communication loss, look at the network.
Rockwell does this differently and it catches things the panel cannot. On CompactLogix 5380, CompactLogix 5480 (Logix Designer 37 and earlier), ControlLogix 5580, ControlLogix 5590 and GuardLogix 5580 controllers, up to 500 log entries are buffered in controller memory. The controller can be configured to write buffered entries to removable media after 400 entries, so the history can outlive the controller’s own memory.
That log records events including firmware updates, and forces enabled, disabled, removed or modified, each with a time stamp and a user name. Somebody forced an output at 3:40 in the afternoon and walked away. The log knows who. It is the most useful troubleshooting feature on the platform and it sits unused in most panels I open.
Module and channel level faults
The buffer names the module and the channel. The raw value alone does not.
Why 32767 means three different things
A Siemens analog channel can return 32767, which is 16#7FFF, for three completely different reasons: overflow, values not yet valid such as immediately after power up, and a detected wire break.
Table 2: Three causes behind the same 32767 reading
| Reading | Cause | What distinguishes it |
|---|---|---|
| 32767 | Overflow | Overflow diagnostic event |
| 32767 | Values not yet valid, just after power up | It clears on its own |
| 32767 | Detected wire break | Wire-break diagnostic, where enabled |
One of those resolves itself in two seconds. The other two need a screwdriver.
For a 4-20 mA channel the raw value tells you more if you know the scale. Values from -1 to -691 mean the current sits between 3.9994 mA and 3.6 mA, which is underrange. A wire break returns 32767 where wire-break diagnostics are enabled.
Analog modules distinguish wire break, underrange and overrange, and overflow as separate diagnostic events, and those events appear both in the module’s online diagnostics and in the CPU diagnostic buffer. The raw value is ambiguous. The diagnostics are not.
The special register map on the FX5U
Mitsubishi’s FX5U built-in analog works on a different map and catches people who came from the other families. Channel 1 input data sits in special register SD6020, channel 2 in SD6060. Those are values, not diagnostics.
The diagnostics live in special relays, in an A/D conversion error flag area, with SM6059 for channel 1 and SM6099 for channel 2. The module also has over-scale detection, digital clipping and a warning output function.
Table 3: FX5U built-in analog registers and flags
| Address | Channel | What it holds |
|---|---|---|
| SD6020 | Channel 1 | Digital input value |
| SD6060 | Channel 2 | Digital input value |
| SM6059 | Channel 1 | A/D conversion error flag |
| SM6099 | Channel 2 | A/D conversion error flag |
The trap is digital clipping. With clipping enabled, an over-range signal gets clamped to the top of the scale and looks plausible in the register. The value is not wrong. It is clipped. You chase a sensor that is fine and miss the flag saying the input is out of range.
Caution: a clipped value and a healthy value at the top of the scale are indistinguishable in the register. Check the error flag before trusting any reading near full scale.
Three faults that look like program bugs, not plc diagnostics
I have been called out for all three, and every time the program was fine.
The first is a floating analog input. The logic compares a level to a setpoint, the level drifts into underrange, the comparison goes false, and a pump stops. The transition looks abrupt on the trend, so it reads as a logic fault. The buffer shows four minutes of underrange. The program did what it was told.
The second is a forced value somebody forgot. Rockwell logs it with a user name and a time stamp. Siemens shows it in the force display. Either way the logic is being lied to, and online monitoring will not reveal it, because the monitor shows the forced value as though it were real.
The third is a module that dropped out of the rack configuration. A tag now reads as a communication failure, the arithmetic downstream produces nonsense, and an interlock trips. The buffer names the module. The program names nothing, because from its side the data simply stopped arriving.
Any fault that appears instantly and completely, with no gradual trend, is a data problem and not a logic problem.
A five minute diagnostic routine to keep in the panel
Print this and tape it inside the door. The point is not that it is clever. The point is that it is identical every time, so nobody has to think at 2 am.
- Read the mode switch position physically. RUN, PROG, REM. Confirm with your hand, not the screen.
- Read the status display or indicator pattern and write it down before you interpret it.
- Look the pattern up in the manual’s indicator table, at the panel, not from memory.
- Open the controller diagnostic buffer or log. Read from the oldest entry forward.
- Note the first entry after a quiet period, and its time stamp.
- Decide whether that entry is an I/O event, a mode change, or a communication loss.
- Open the named module’s diagnostics and read the channel-level event.
- Compare the raw value against the module’s event and resolve the ambiguity.
- Check for forces, enabled and forgotten.
- Only now open the program.
Table 4: Which entry type points where
| First buffer entry | Likely location | Do not start with |
|---|---|---|
| I/O or channel event | Field wiring, sensor, terminal | Logic |
| Mode change to STOP | Controller fault, memory, configuration | Field devices |
| Communication loss | Network, cable, node address | Analog scaling |
| Cycle time exceeded | Program load, task configuration | Wiring |
| Force modified | Maintenance activity | Anything else |
The paperwork that belongs in the panel
For the paperwork side, keep this in the panel too:
- ☐ Indicator table printed from the controller manual
- ☐ Fault code table for the controller family, held offline
- ☐ Wiring diagram for every analog card in the rack
- ☐ A blank log sheet: date, time, first buffer entry, action taken
- ☐ The current program archive, dated by hand
Rockwell collects controller and I/O fault codes in publication 1756-RD001, referenced from the 5069 user manual. The code number maps to a described cause in that table, and the table is not in your head. Have it offline before you need it, because downloading a manual over a plant network at 2 am while a line is down is a special kind of frustration.
Warning: the moment you need the fault code table is the moment you cannot reach the internet. Put it on the machine, not in the cloud.
That is the routine. Ten steps, one sheet of paper, and no laptop until step ten.
About TZ Tech
TZ Tech supplies industrial automation, electrical, instrumentation and telecommunications components, including rare and discontinued parts other suppliers can’t source. We buy ready-to-ship distributor stock, so prices stay competitive and lead times stay short.
You get the part you ordered, at the price and lead time we quoted. Legacy and discontinued items come with an honest, accurate report on their real condition, so there are no surprises when the box arrives.
Send your inquiry and you hear back within 6 hours. In-stock items ship without delay.
Every component is screened and inspected before it leaves us. Brand-new parts carry a full 1-year warranty.
If a part isn’t right, we make it right, and we stay reachable after the sale.
Have a project or a part you need? Send us the details and we’ll get back to you fast.
Contact us →